I had the chance to be a part of this project where we aimed to explore how data analysis techniques could benefit the healthcare sector. Together with a group of committed individuals, we worked on understanding the connections between environmental factors like light and sound, and the growth patterns of preterm infants.
This experience let me get a good grasp of data analysis, machine learning, and collaborative research, helping me develop my skills and get ready for upcoming challenges in the data science field.
Before we start sharing our journey, I want to point out that, due to the sensitive nature of the data involved, I'll only be sharing general insights without going into detailed specifics. Below, I invite you to join us on our journey, highlighted with a selection of slides that give a peek into our objectives and findings.
Research and Consultation
Initiating our project with a group of doctors and medical students, we undertook thorough research and weekly consultations and fact checks, grounding our project in firsthand experience and factual knowledge.
Data Preprocessing
As we started this analytical journey, the first step was focused on data preprocessing, a crucial part in the pipeline of any data science project. Given the raw and complex state of the initial data, our team spent a good amount of time cleaning and organizing the data properly. This careful process not only made handling the data easier but also set a solid base for the next stages of EDA and feature engineering, paving the way for insightful and accurate analyses later on.
Exploratory Data Analysis (EDA) and Feature Engineering
In this important phase, our team dived into the details of exploratory data analysis (EDA) and feature engineering. This stage involved a detailed study of various features and how they relate to each other, helping us understand more about the factors affecting the growth patterns of preterm babies.

Supervised Learning
Moving forward, we turned our attention to supervised learning, using models to identify significant feature importances. This analytical phase revealed more insights about the data.

Unsupervised Learning
Going further, we adopted unsupervised learning strategies, focusing mainly on analyzing continuous features. This creative approach helped us find hidden patterns and insights, adding a new layer of depth to our analytical journey.

Data Adjustment: Phototherapy Influence
At this stage, we grappled with the complexities of integrating phototherapy data into our analysis, a task vividly captured in the project. This stage was foundational in maintaining the integrity of our dataset. Through various approaches, we managed to exclude the influence of phototherapy variables, allowing for a more focused analysis on the core growth parameters. However, this meticulous process also highlighted the inherent limitations of the available data, nudging us towards a solution that could facilitate broader data acquisition and analysis in the future.

Dashboard Development and Prototype
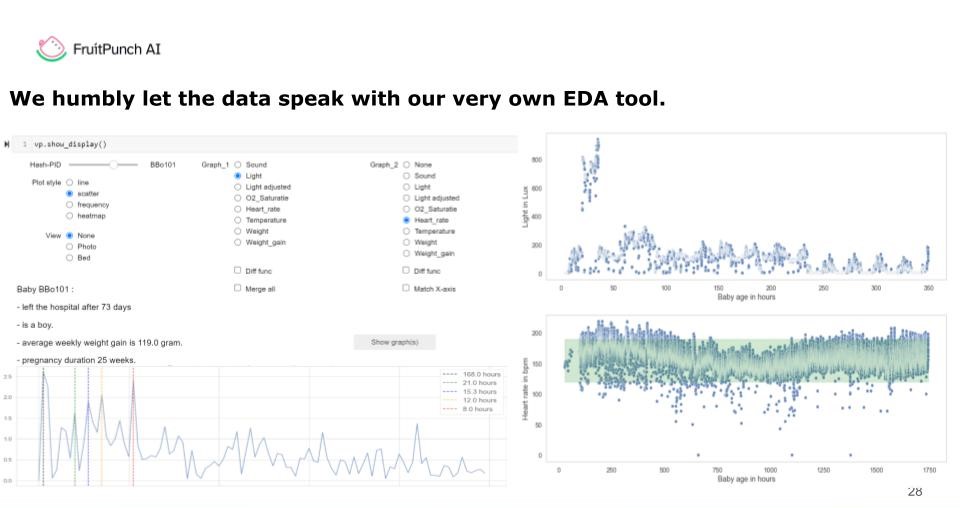
In response to the evolving needs of our project, we developed a prototype dashboard. This dashboard, created to be user-friendly, facilitates the smooth integration of new data. Designed to be approachable even for individuals without a background in coding, it serves as a practical tool for ongoing data input and as a useful EDA tool for medical students and other stakeholders. This functionality allows for the straightforward filtering and analysis of raw data, encouraging an environment where insights can grow with the addition of new data, and making way for further analyses in the future without getting entangled in data processing complexities.

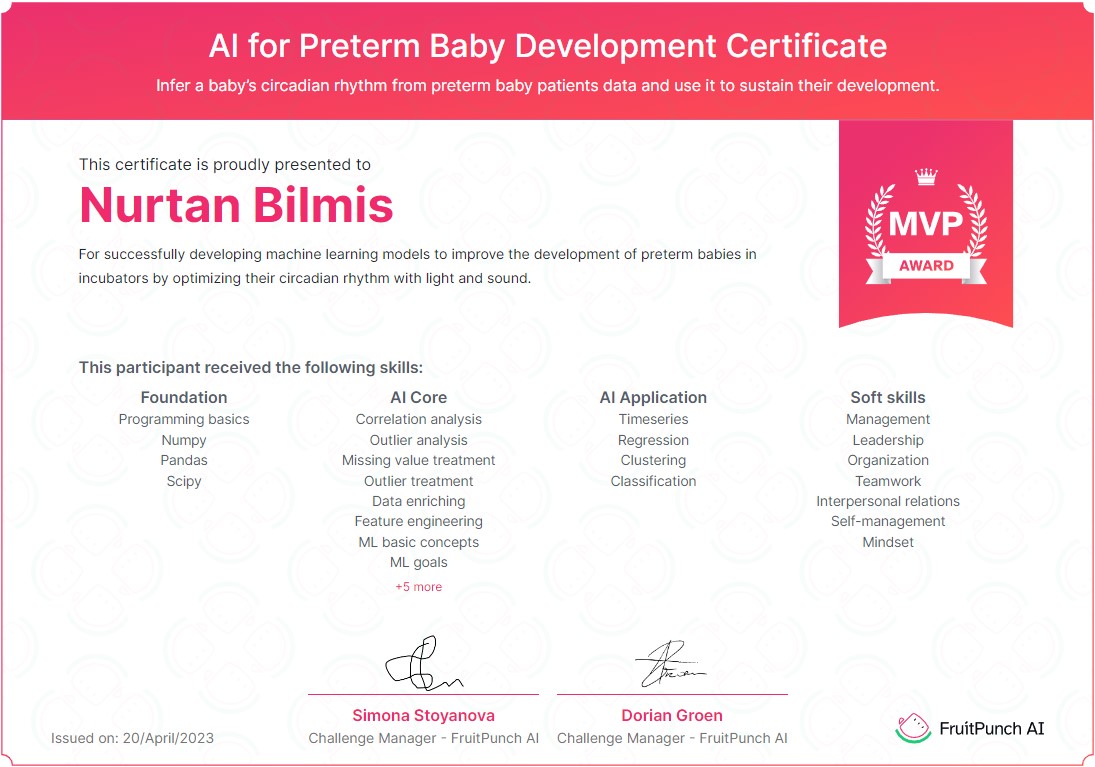
I am pleased to share that my contributions were acknowledged with an MVP award, a recognition that reflects the collective effort and innovation that fueled our project. This acknowledgment, which I am humbled to showcase alongside my certificate in the final visual.